How Observance Works
From scanning to insights, see how we transform construction site data into actionable intelligence
Scanning Schedule
Observance schedules a scan based on the uploaded project data by our customers
Scanning the Site
The sites are scanned using custom hardware created by Inkers, which is cost-effective, scalable, and simple to produce.
Sensor Fusion
The LIDAR, RGB, Thermal and IMU data is synced and fused together to create a multi-modal 3D models
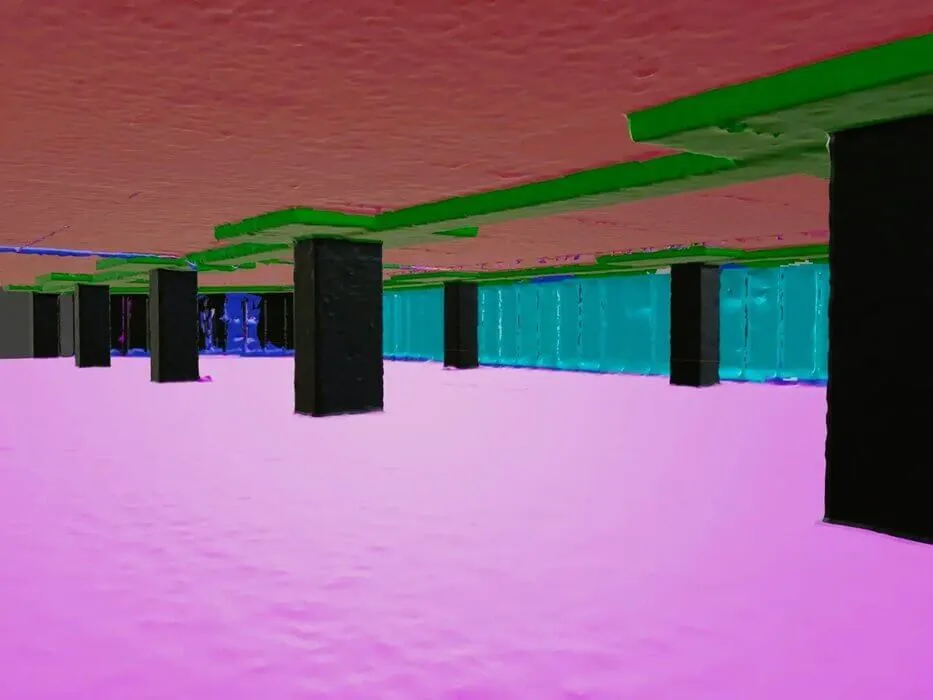
AI 3D Processing
The fused data is processed for layout, construction and 3d deviations
AI Image Processing
RGB, thermal data and videos are then processed for concrete and leakage related defects and overlayed on 3D models
BIM Creation
3D data are further processed and converted to industry industry formats (BIM, Sketchup, IFC, etc)
Actionable Reports
Finally a succint and actionale reports are generated to get immediate understanding of issues, progress and status.
Scan Process
Capture Process
Engineers use the handheld LITHIC scanner to walk through the project site, capturing the data.
Scan Data
The LITHIC scanner collects RGB, thermal, IMU, and LiDAR data, stored on its integrated SSD.
Scanning Duration
A 50,000 sqft site can be scanned in approximately 45 minutes. No site pre-cleaning required.
Scan Period
Scans are performed periodically to update the 3D model with real-time site progress.
Drone Scanning
Leverage autonomous drone technology for comprehensive site data acquisition, enhancing safety and efficiency.
Drone LITHIC
Seamlessly integrates with drones for capturing both exterior and interior site data.
Geo Location
Drone outputs are georeferenced with 1-meter accuracy, enabling precise site placement on Google Maps.
Capture Process
Remotely piloted drones follow pre-programmed routes for complete site coverage.
Output Process
Collected data updates the 3D model, reflecting real-time site progress.
LITHIC Drone Specifications
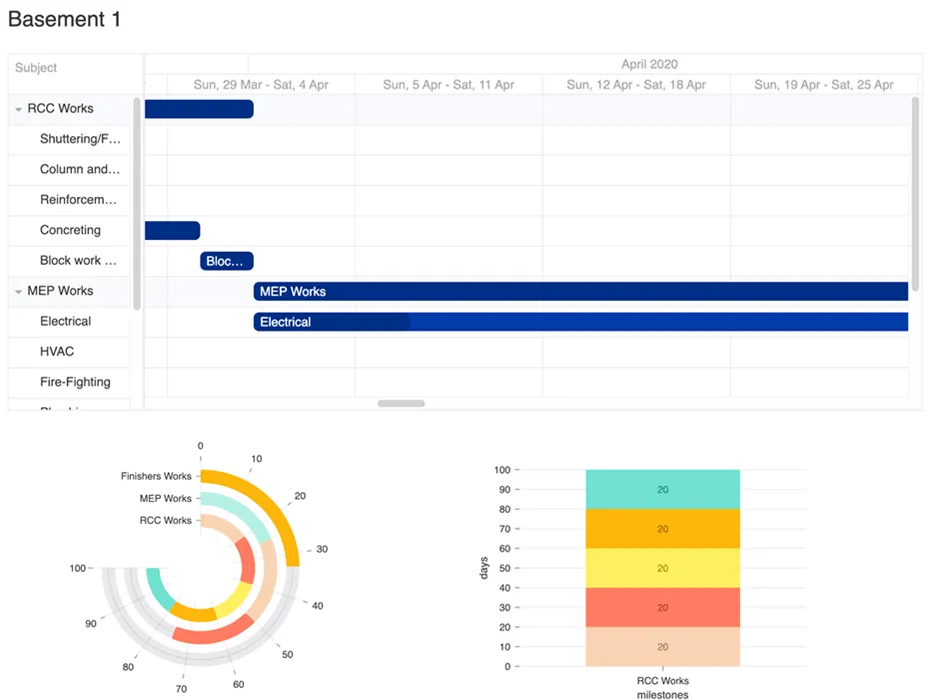
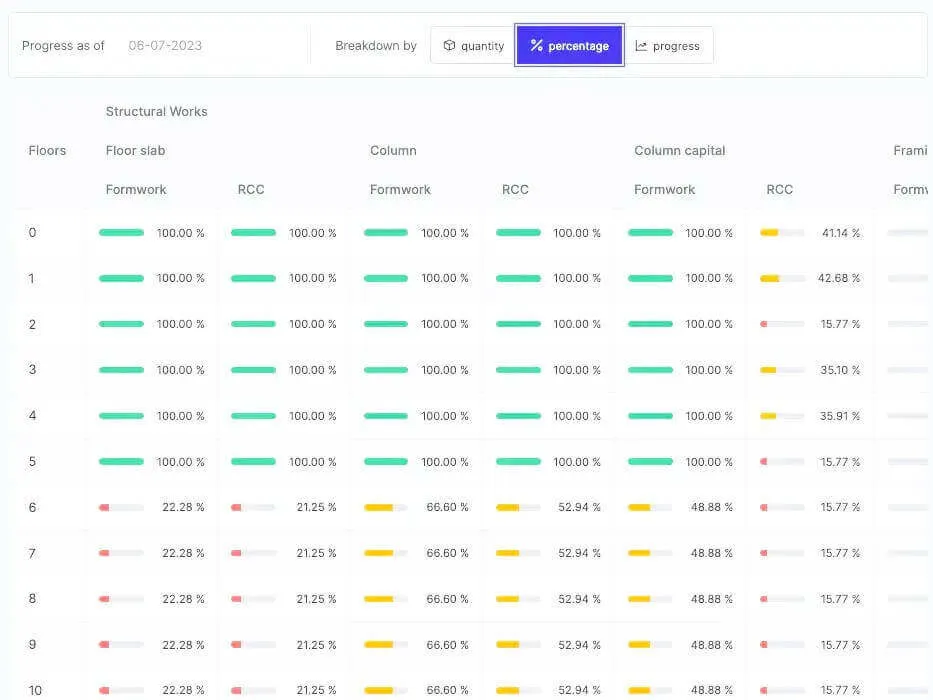
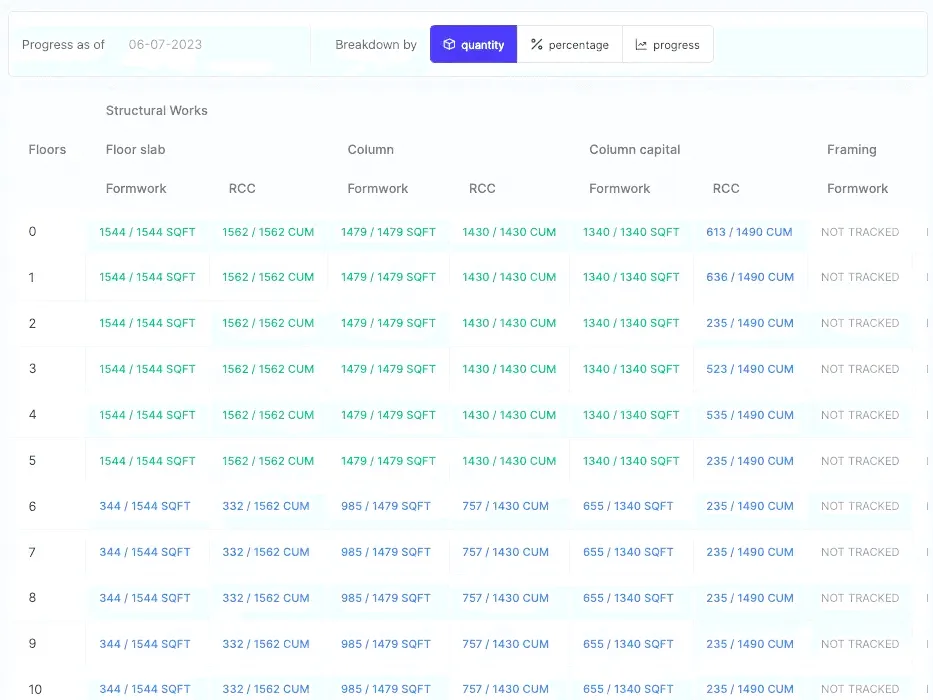
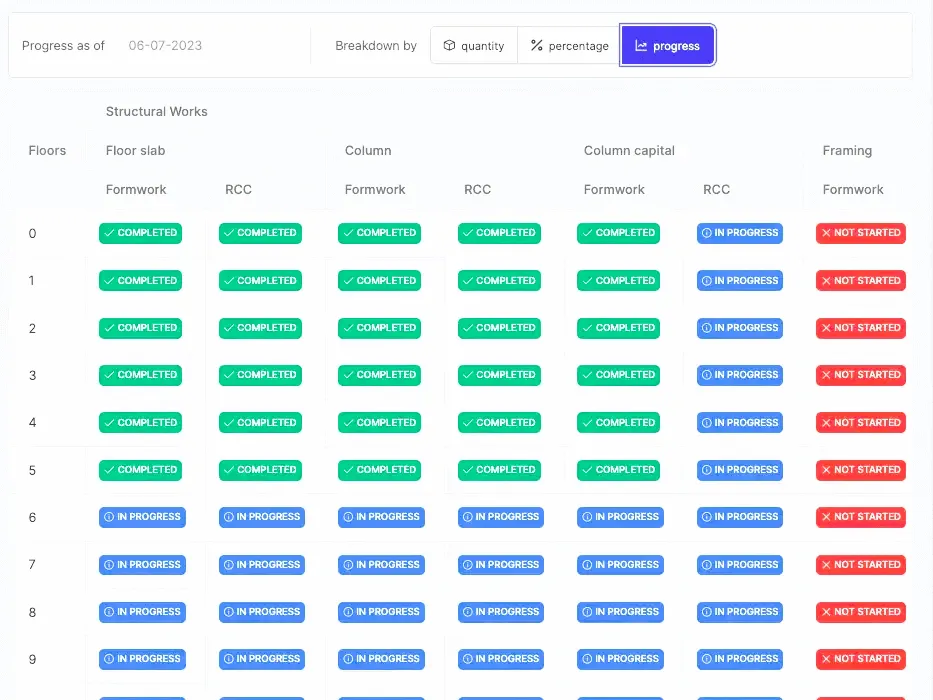
Automated Milestones and Scheduling
Witness the ease of tracking, managing, and executing construction projects like never before. No BIM? No problem! Observance can still craft your project milestones and schedule tracking with impeccable precision. Remember, with us, BIM is an option, not an obligation. BIM or not, we've got your analytics covered!
Real-time Tracking
Monitor construction progress in real-time with automated milestone tracking and instant updates.
Smart Scheduling
AI-powered scheduling optimization that adapts to your project's unique requirements.
BIM Integration
Seamlessly integrate with existing BIM models or work independently with our advanced tracking system.
Analytics Dashboard
Comprehensive analytics and insights to make data-driven decisions for your construction projects.
Downloadable in
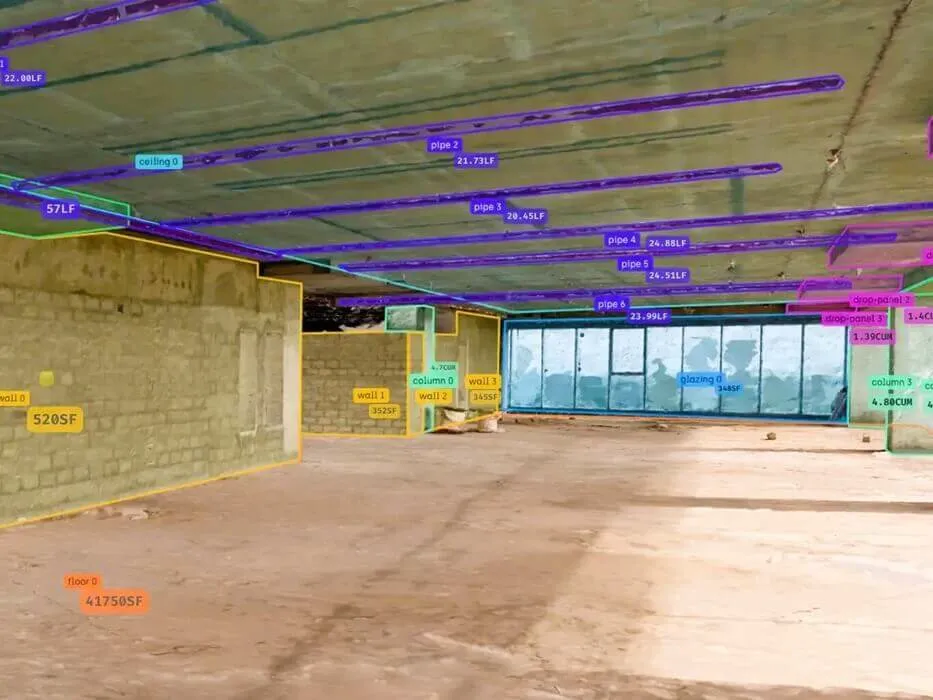
The Measurable 3D Model!
Unlock unparalleled insights with our fully interactive and measurable 3D models. Navigate, analyze, and export with ease.
3D Mesh
Freely navigable, downloadable, and measurable as-built 3D model available on Observance.
2D Plan
Vectorized, scaled as-built floorplan with DXF (AutoCAD) export option.
Measurements
Supports accurate linear, angular, area, and volume measurements in imperial or metric units.
Accuracy
Observance outputs achieve 99.6% measurement accuracy.
Powerful Toolkit
As-Built 2D Drawings
Transform complex 3D site data into clear, actionable 2D drawings. Our automated process delivers precise documentation for every stage of your project with comprehensive technical drawings extracted directly from Digital Twin models.
Key Drawing Outputs
Complete set of technical drawings automatically generated from your Digital Twin data for comprehensive project documentation.
Floor Plan Drawings
Comprehensive floor plans extracted from 3D models showing room layouts, dimensions, and spatial relationships for all project levels.
Reflected Ceiling Plans
Detailed ceiling plans showing lighting fixtures, HVAC outlets, sprinkler systems, and all overhead building services.
Section & Elevation Drawings
Precise cross-sections and elevations revealing building heights, floor-to-ceiling relationships, and structural details.
Technical Documentation
Complete set of construction drawings including plot surveys, spot elevations, and detailed architectural specifications.
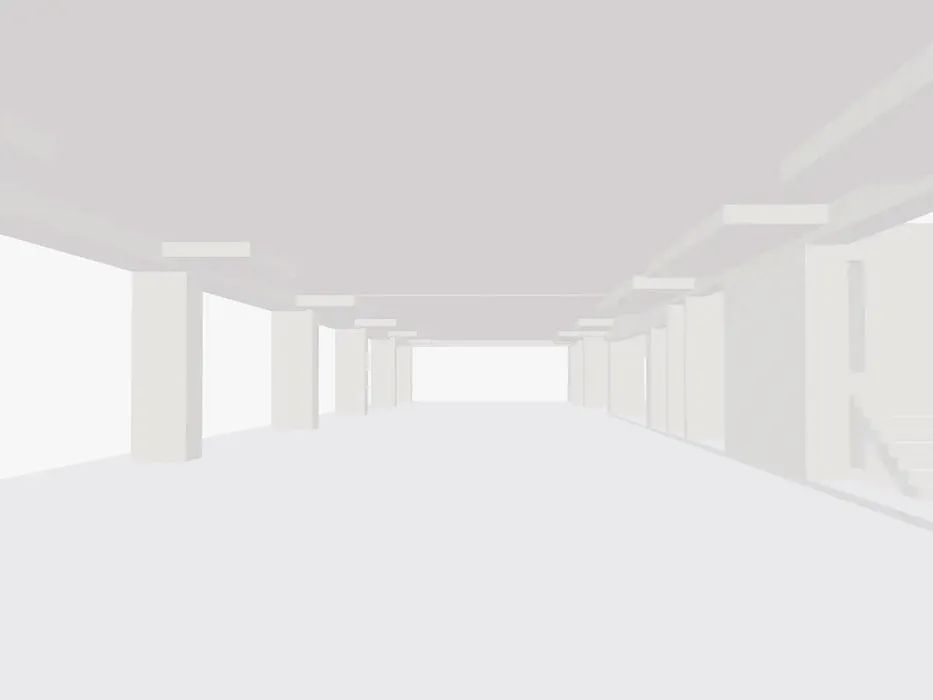
As-Built 3D Model
Measurable 3D BIM
Automatically generates an accurate, detailed 3D as-built model of the project site or floor.
Segmented 3D Model
Processes the 3D map through advanced segmentation for a clear and well-defined model.
Highly Compressed 3D Model
Optimized for easy access on Observance, fully navigable and compatible with web-based viewers like Autodesk.
Thermal Analytics
Processing
Thermal camera data is synchronized with RGB camera data to the millisecond, creating a thermal-textured 3D model for precise thermal analysis.
Moisture Seepage
Remap thermal texture sensitivity to detect moisture patterns, enabling early leak and seepage identification.
Leak Profiling
Analyze MEP installations for integrity checks and automated leak detection.
Defect Analytics & Punch Lists
Snags AI
Automatically detects common snags like cracks, honeycombs, chipped surfaces, uneven textures, cement slurry, and moisture seepage, generating punch lists.
Annotated in 3D
Snag items are mapped onto 3D models as annotations with corresponding camera images for clear identification.
AI Training
Trained on over 400,000 annotated images, the AI detects 30+ defect types with high accuracy.
Slider View
Old Scan vs New Scan
Compare two scans or videos from different dates using a slider to highlight changes, with full support for Section Plane, Measurement, and Annotations.
Peel Off
Reveal synchronized models and videos to examine elements across different timelines at the same location.
Scan History
Visualize time-lapse changes over multiple scans, precisely aligned to track progress.
Side-By-Side Views
3D Scan vs Camera Video
View the 3D textured model alongside synchronized camera and thermal videos, matched to the closest 3D viewpoint.
3D Scan vs BIM Model
Compare the scan model with BIM using color-coded textures to highlight differences, configurable within a 0-1 meter range.
RGB vs Thermal
Synchronize and compare RGB and thermal camera videos side-by-side for detailed analysis.
Task Manager
Annotations to Tasks
Convert 3D annotations, snags, and PPE violations into tasks with start dates, due dates, and status tracking.
Task Features
Assign tasks to multiple individuals, create subtasks, and reassign tasks, all visualized on a detailed Gantt chart.
Access Controls
Hierarchical task management ensures subtasks are completed before parent tasks. Automatic audit trails document all changes.
Ready to Transform Your Construction Projects?
Experience the power of AI-driven construction monitoring with Observance. From real-time 3D scanning to automated defect detection, we help you build smarter, faster, and safer.
Join leading construction companies who trust Observance for their project success.