Observance Thermal
Uncover hidden moisture and pinpoint leak sources with comprehensive 3D thermal models. We turn complex thermal data into clear, actionable insights for building integrity.
See the Unseen, in 3D
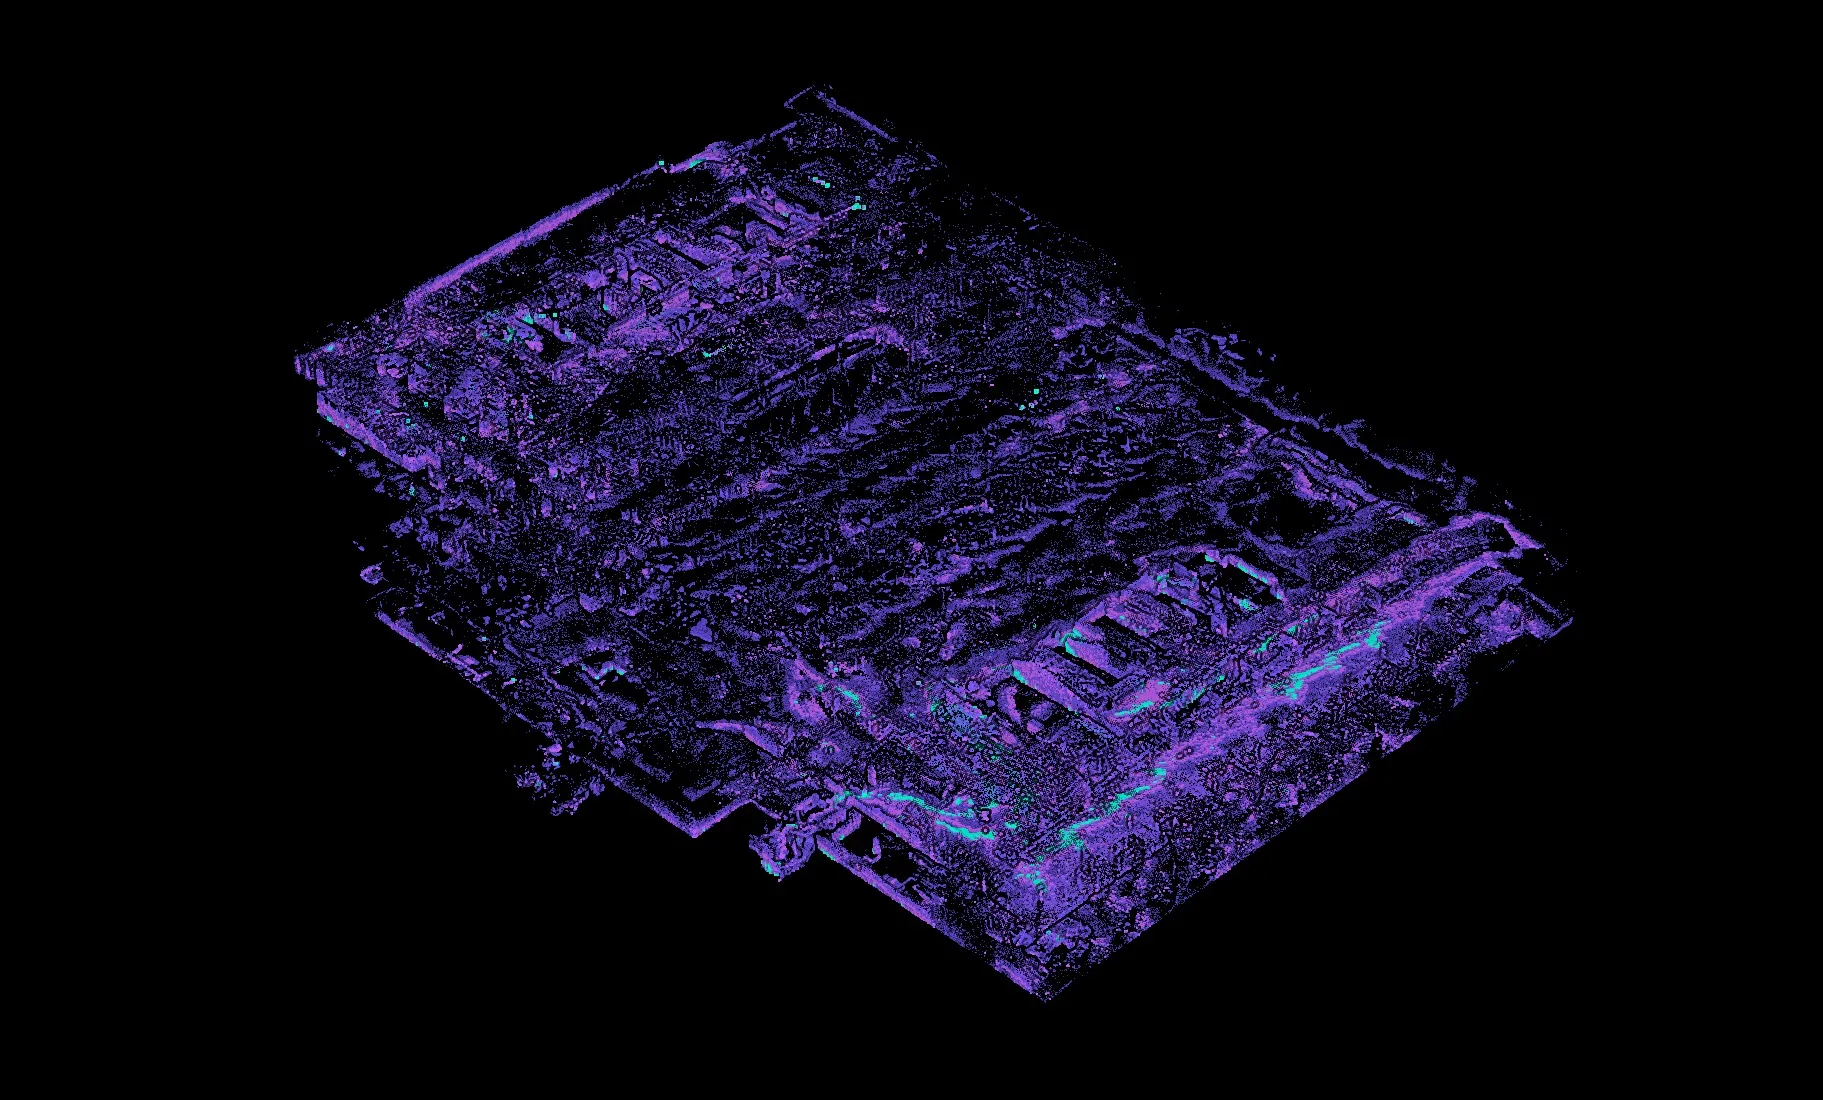
3D Thermal Textured Mesh
Our LITHIC Pro hardware creates a complete 3D model where every point contains precise thermal data, offering a holistic view of your structure's thermal state.
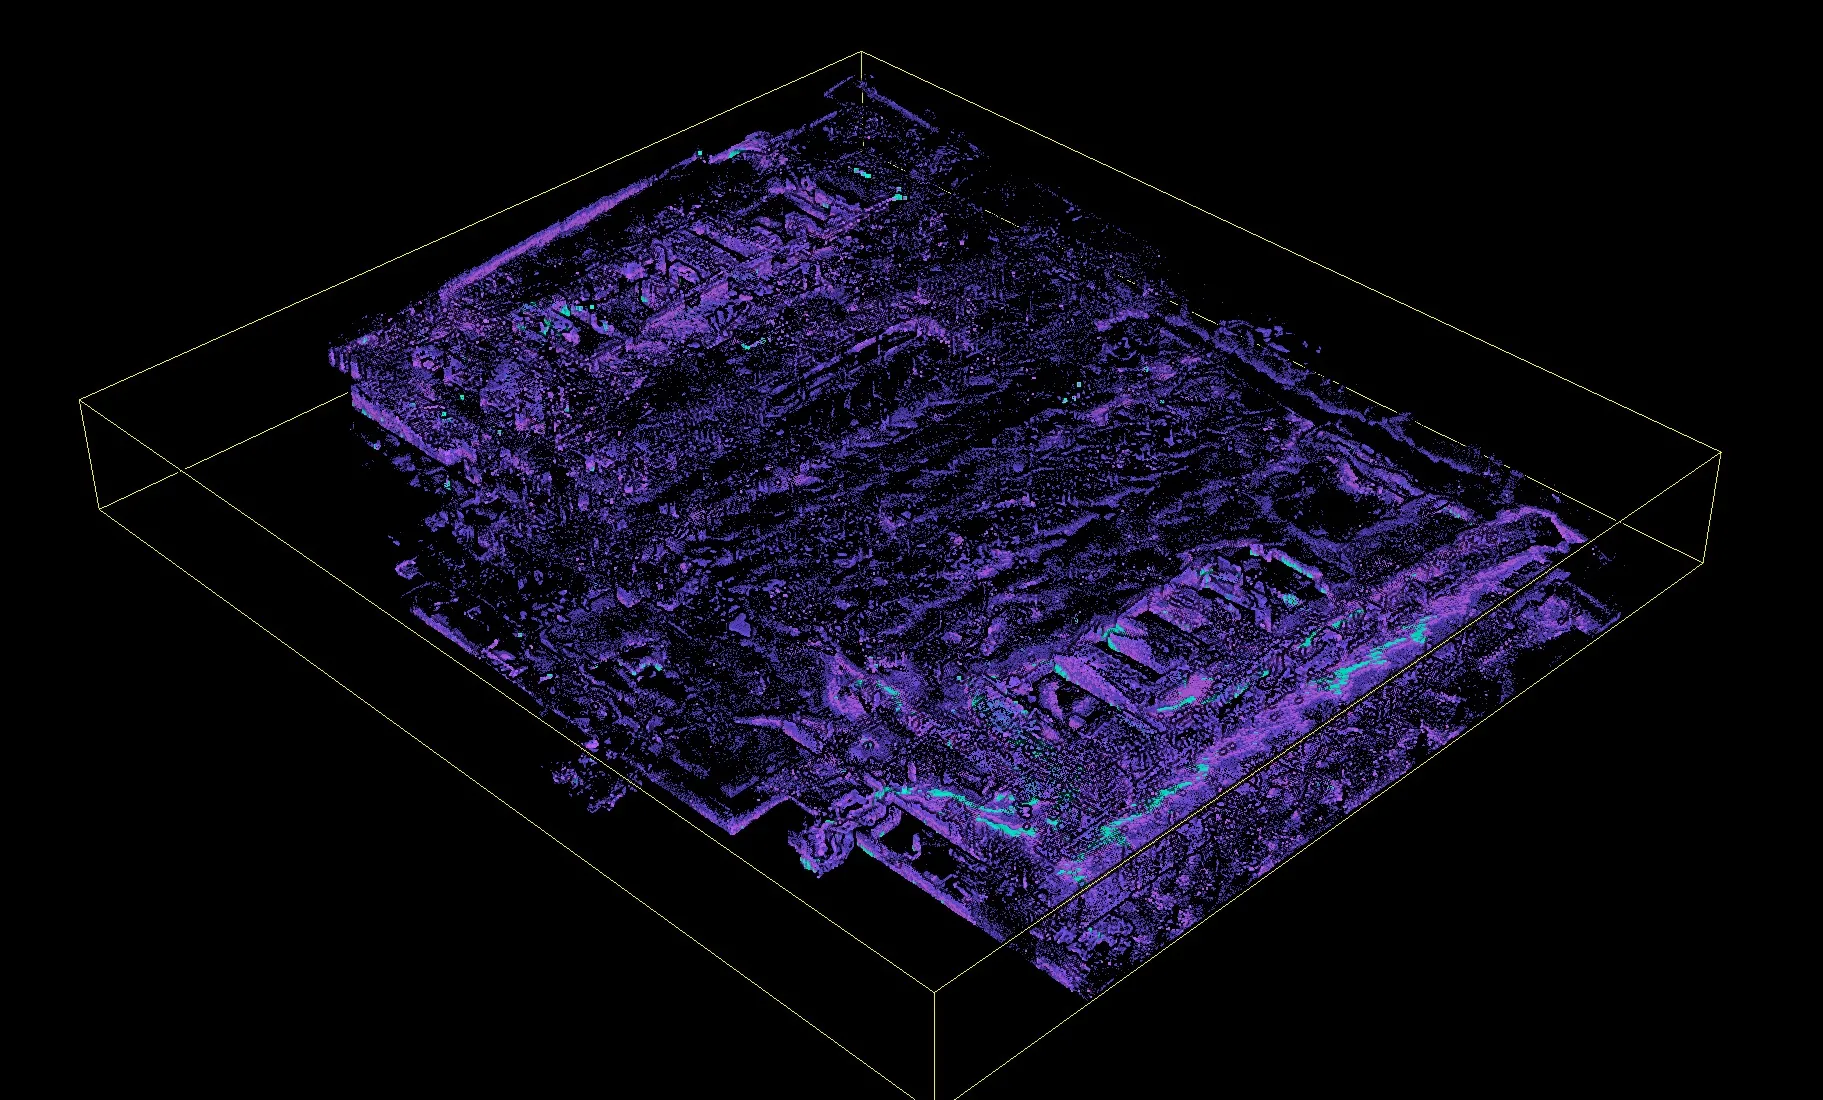
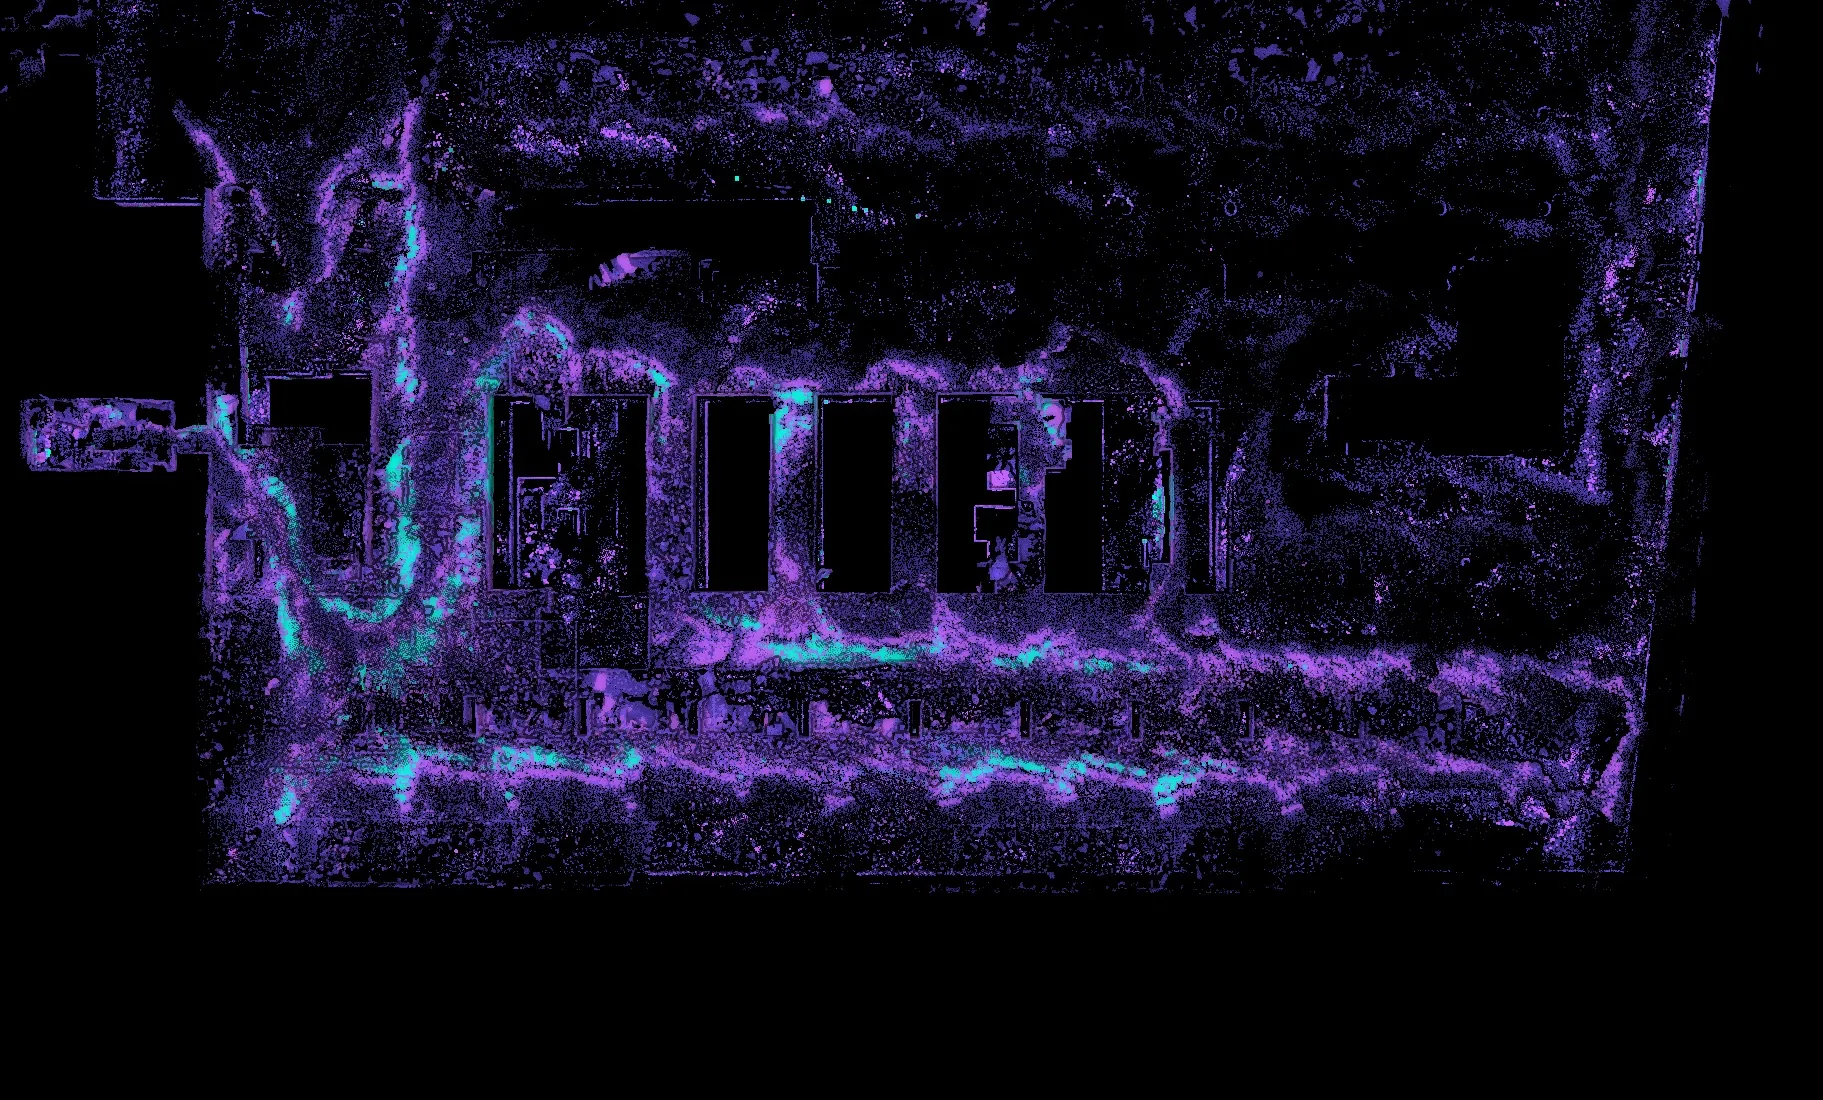
Progressive Point Cloud
Visualize the trajectory of water seepage by progressively filtering from low to high temperatures, effectively tracing leaks back to their origin.
Multi-Floor Leak Tracing
Scan and stack multiple floors in a single 3D model to easily identify and track leaks that travel vertically through the building.
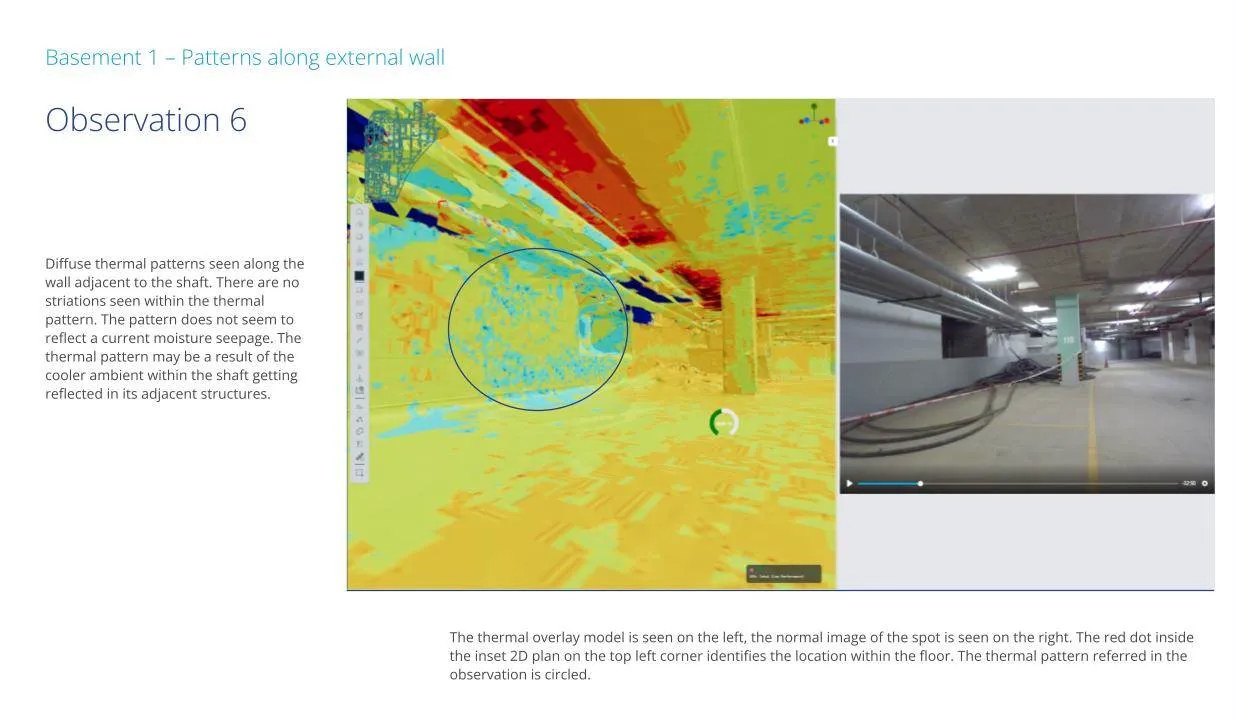
Side-by-Side Analysis
Correlate thermal data with high-resolution RGB video and 3D models to confirm anomalies and provide conclusive evidence of issues.
Actionable Anomaly Reports
Receive detailed reports that highlight areas of significant thermal deviation, complete with 2D floor plan markings for targeted repairs.
Early & Hidden Defect Detection
Identify moisture and insulation issues invisible to the naked eye long before they cause visible damage like paint flaking or mold.
Dynamic Leak Path Visualization
Witness how our technology transforms static temperature data into a dynamic story of moisture movement, making it easy to understand and address complex leaks.
Visualize Leak Paths in Motion
Our Progressive Point Cloud technology animates thermal data to reveal the hidden paths of moisture intrusion, making diagnosis intuitive and accurate.
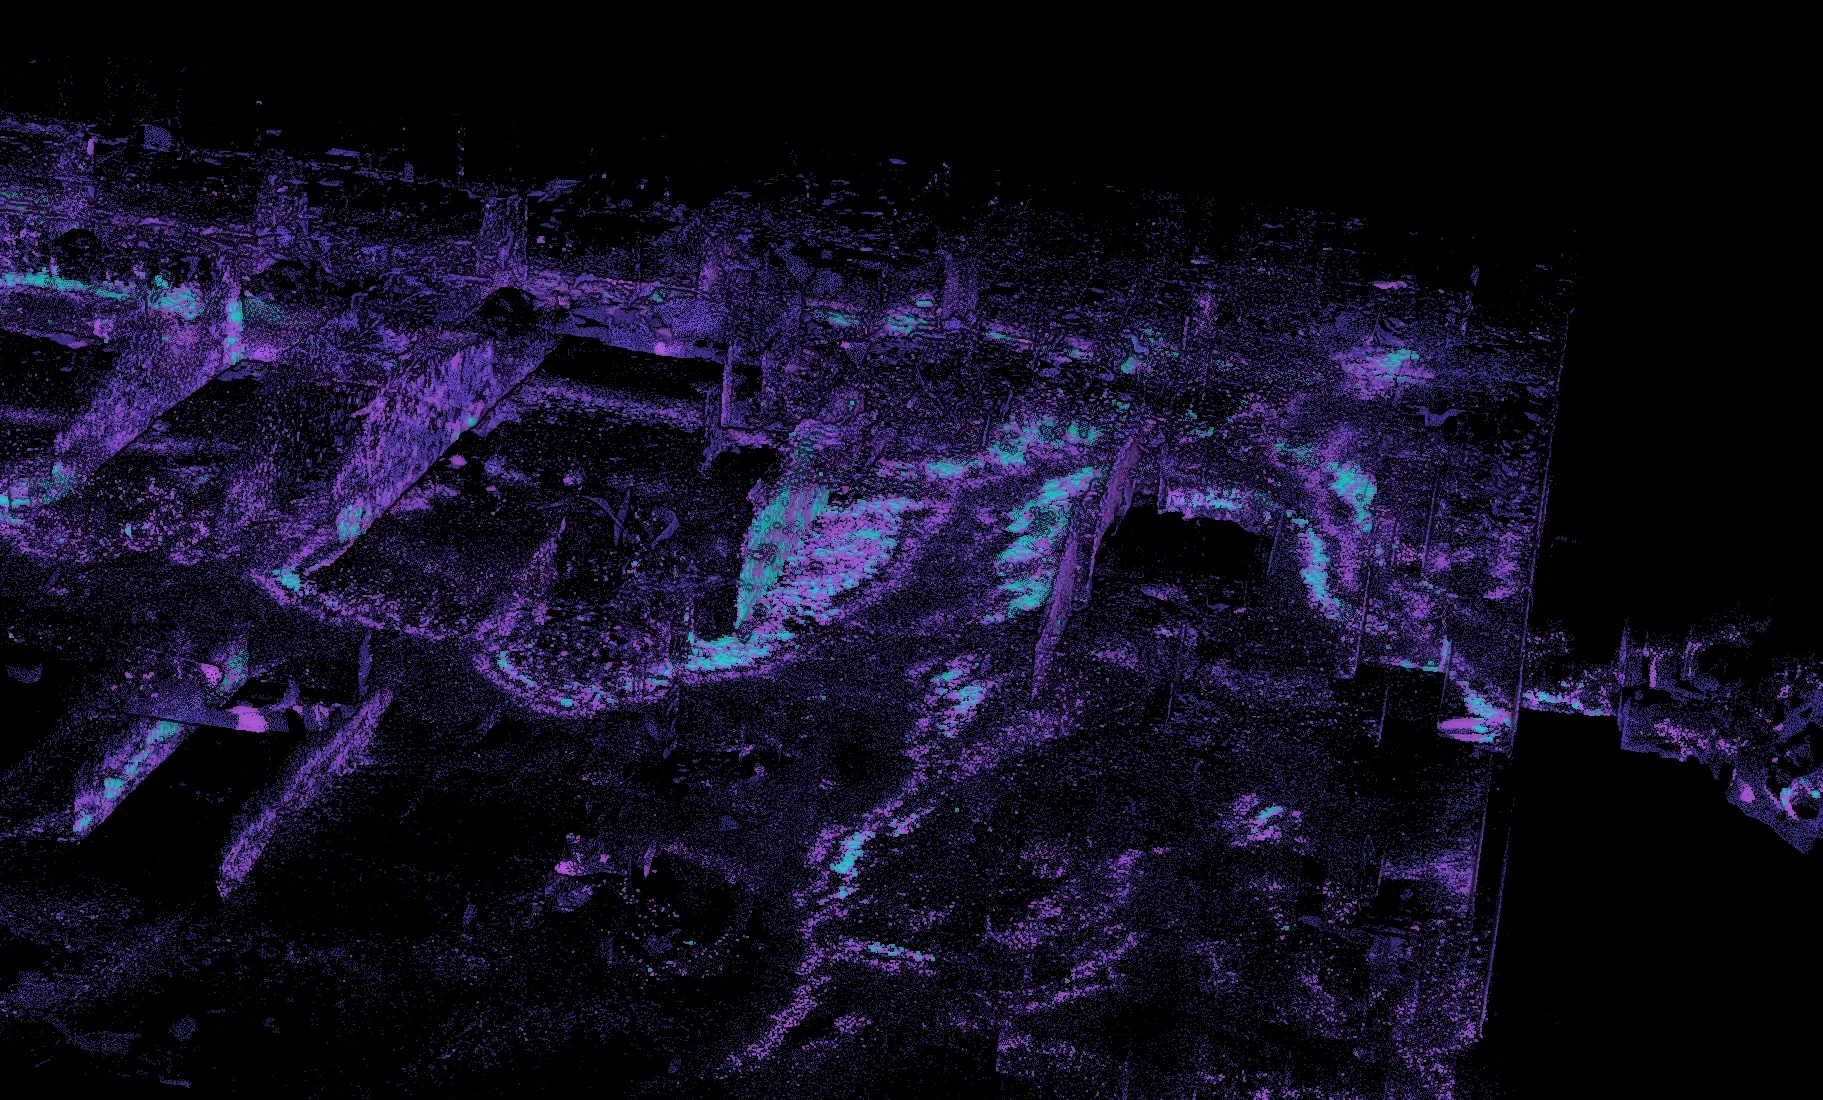
Progressive Point Cloud: Tracing Leaks to Their Source
Our innovative Progressive Point Cloud technology visualizes moisture paths by incrementally displaying thermal data from coldest to warmest. This allows us to trace a leak from its symptom back to the source.
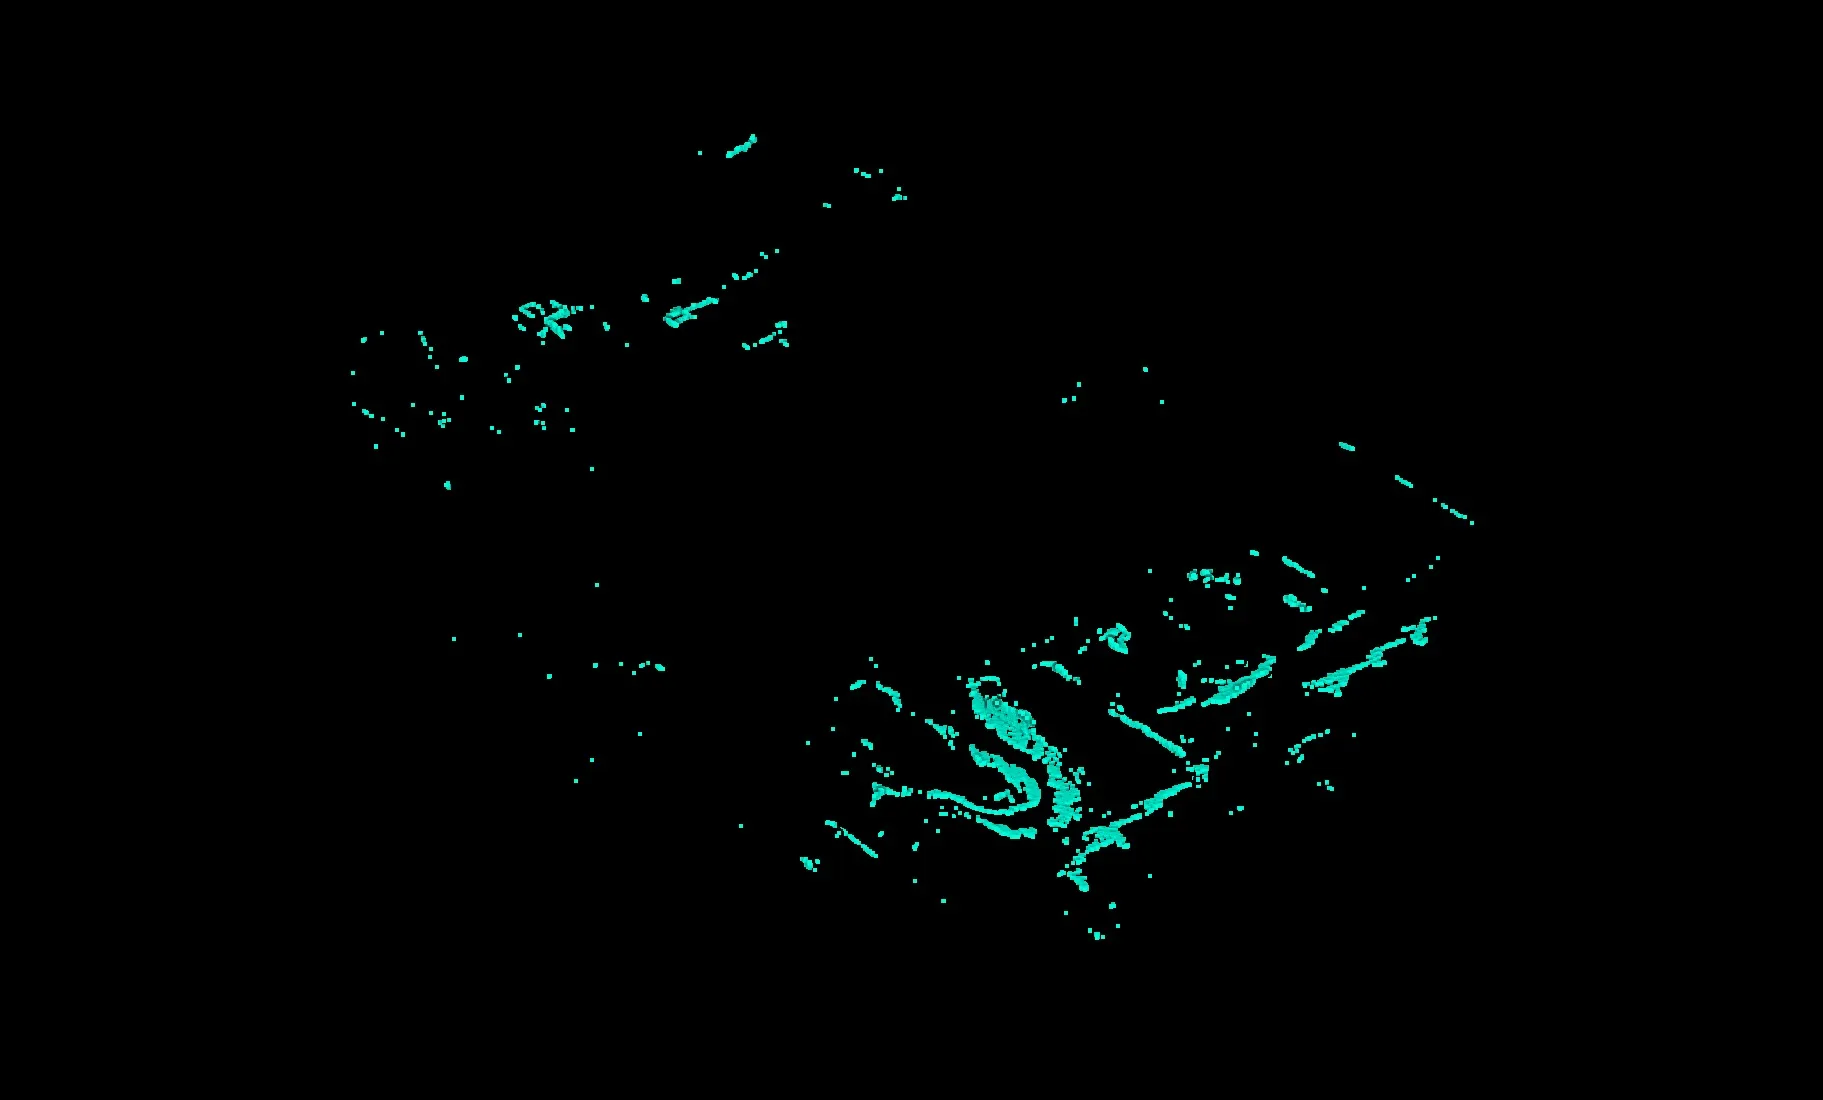
Step 1: Lowest Temperature Range
The process begins by isolating the coldest points in the thermal point cloud. This often highlights the initial accumulation of moisture.
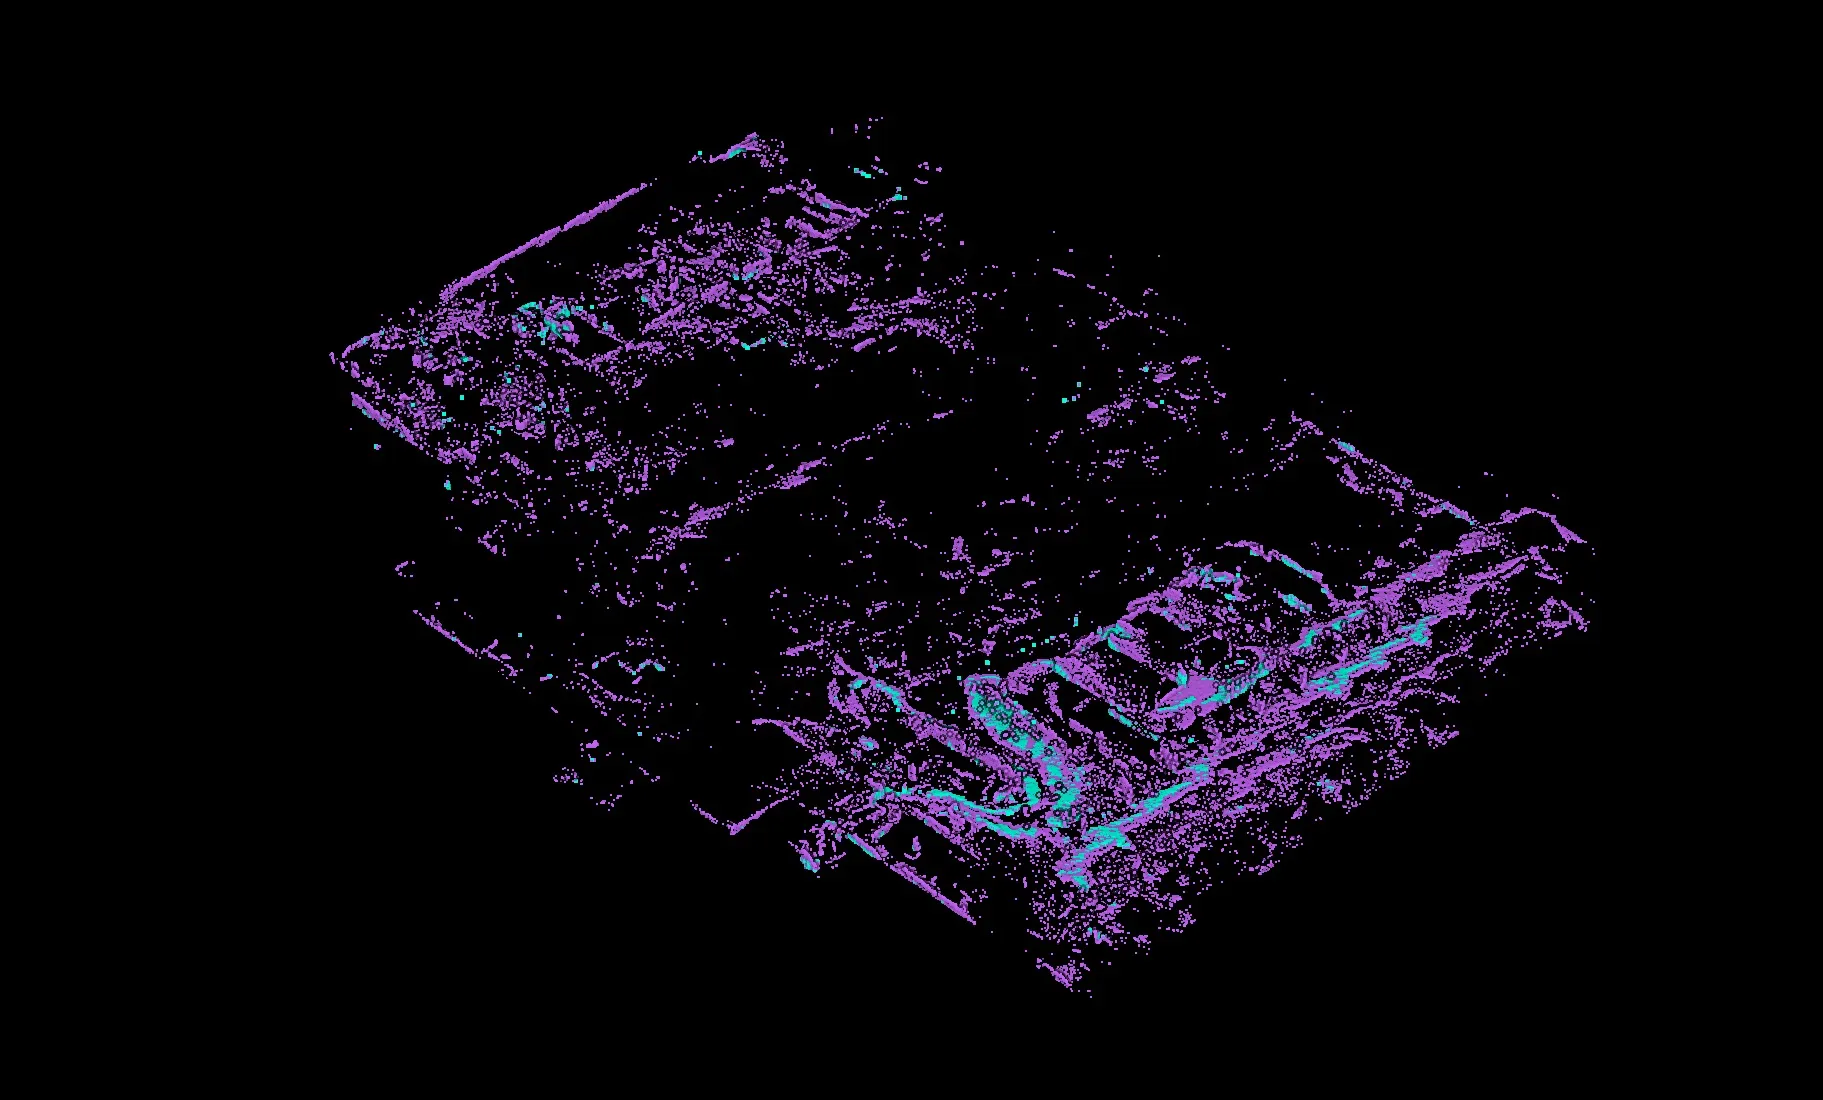
Step 2: Expanding the Thermal Threshold
As the temperature filter is gradually increased, more points are revealed, showing the immediate spread of moisture from the coldest areas.
Step 3: Following the Moisture Path
The expanding point cloud starts to form a clear trajectory, indicating the path the water is taking through the structure.
Step 4: Pinpointing the Leak Source
By visualizing the complete thermal gradient, the origin of the seepage becomes evident, allowing for precise and targeted repairs.
Clear Visualization on Floor
The resulting thermal pattern on the floor clearly identifies the affected area.
Highlighted Area of Concern
The final analysis highlights the precise area of concern for further investigation and repair.
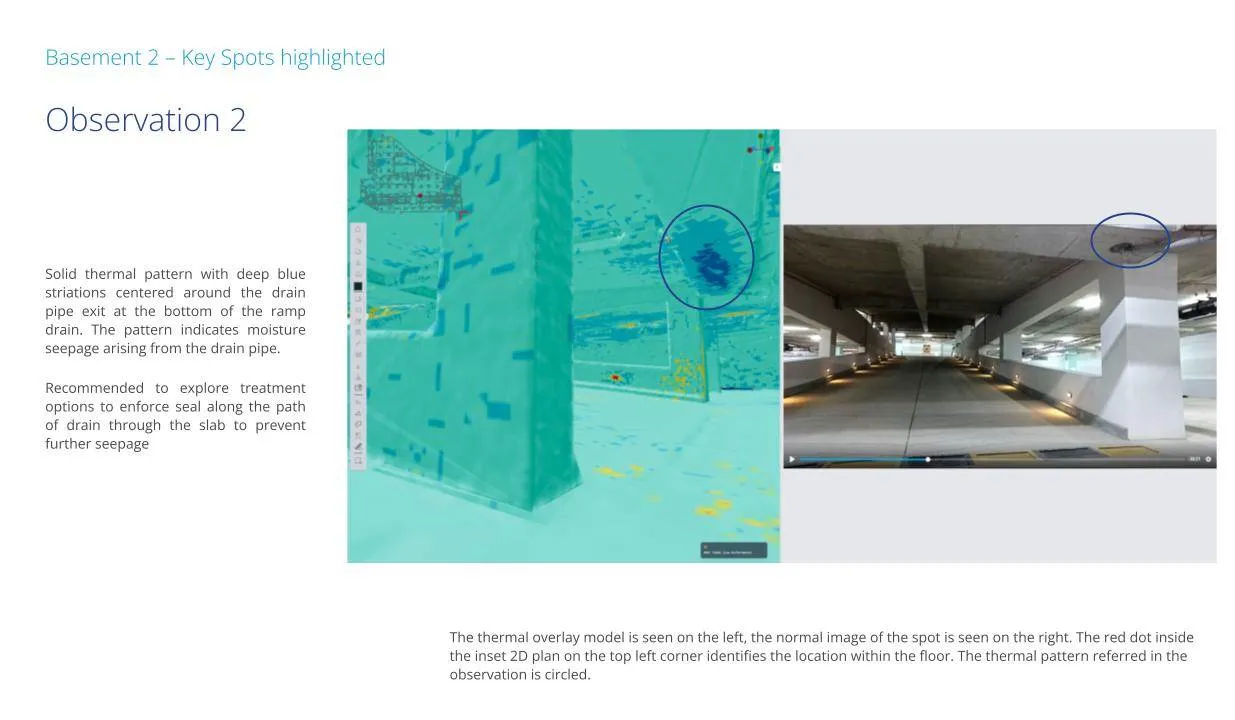
Side-by-Side Confirmation
We eliminate guesswork by providing a side-by-side comparison of the 3D thermal model and the corresponding RGB video. This direct correlation allows for confident verification of thermal anomalies and their physical location, ensuring that what you see in the data is what exists on site.
Correlated Evidence
Directly link thermal hotspots or cold spots to visual evidence from the RGB camera feed.
Enhanced Reporting
Our reports include both views, providing clear and indisputable documentation for stakeholders and repair teams.
Frequently Asked Questions
Find answers to common questions about our Observance Thermal service and how it can protect your assets.
Ready to Uncover Hidden Building Issues?
Don't wait for visible damage. Proactively identify and resolve moisture and leak issues with Observance Thermal. Contact us for a consultation.